UI Overview (Runs Index & Trends)
Smooth, continuous demo (≈18s) showing filtering, quick search, Trend & History, Timeline in Allure, and a brief Dashboard hover.
Tip: If the GIF appears cached, force refresh or bump the ?v= query.
Prefer a shorter preview? Watch the quick demo here:
ui-combo.mp4
(≈30–40s, with brief captions shown right after each click).
A GIF version is also available: ui-combo.gif.
The publishing step generates a lightweight Runs Index and companion pages:
| Page | Purpose | Path (per branch) |
|---|---|---|
| Runs Index | Filterable & sortable historical run table | .../<project>/<branch>/runs/index.html |
| Trend Viewer | Canvas chart (passed / failed / broken) | .../<project>/<branch>/runs/trend.html |
| History Insights | Aggregated metrics & pass rate streaks | .../<project>/<branch>/runs/history.html |
| Latest Report | Full Allure static UI for the most recent run | .../<project>/<branch>/latest/ |
All pages are static HTML + vanilla JS (no external frameworks), designed to load fast behind CloudFront with private S3 storage.
Key UI Features
- Progressive Reveal – Loads first 300 runs, then batches (
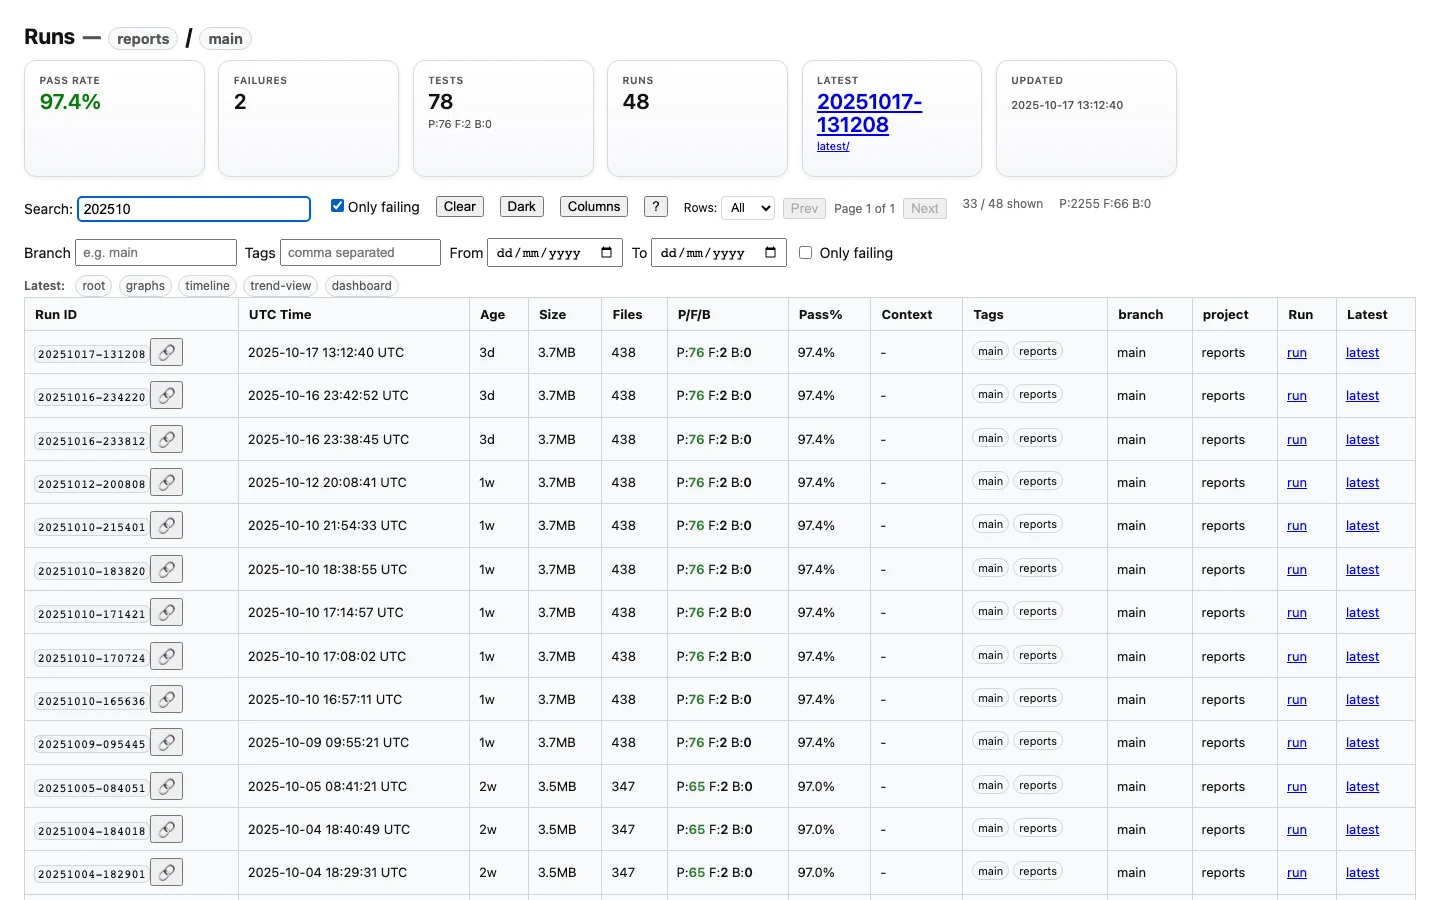
Load more). - Search & Filters – Substring search across IDs, context URLs, dynamic metadata. Optional Only failing toggle.
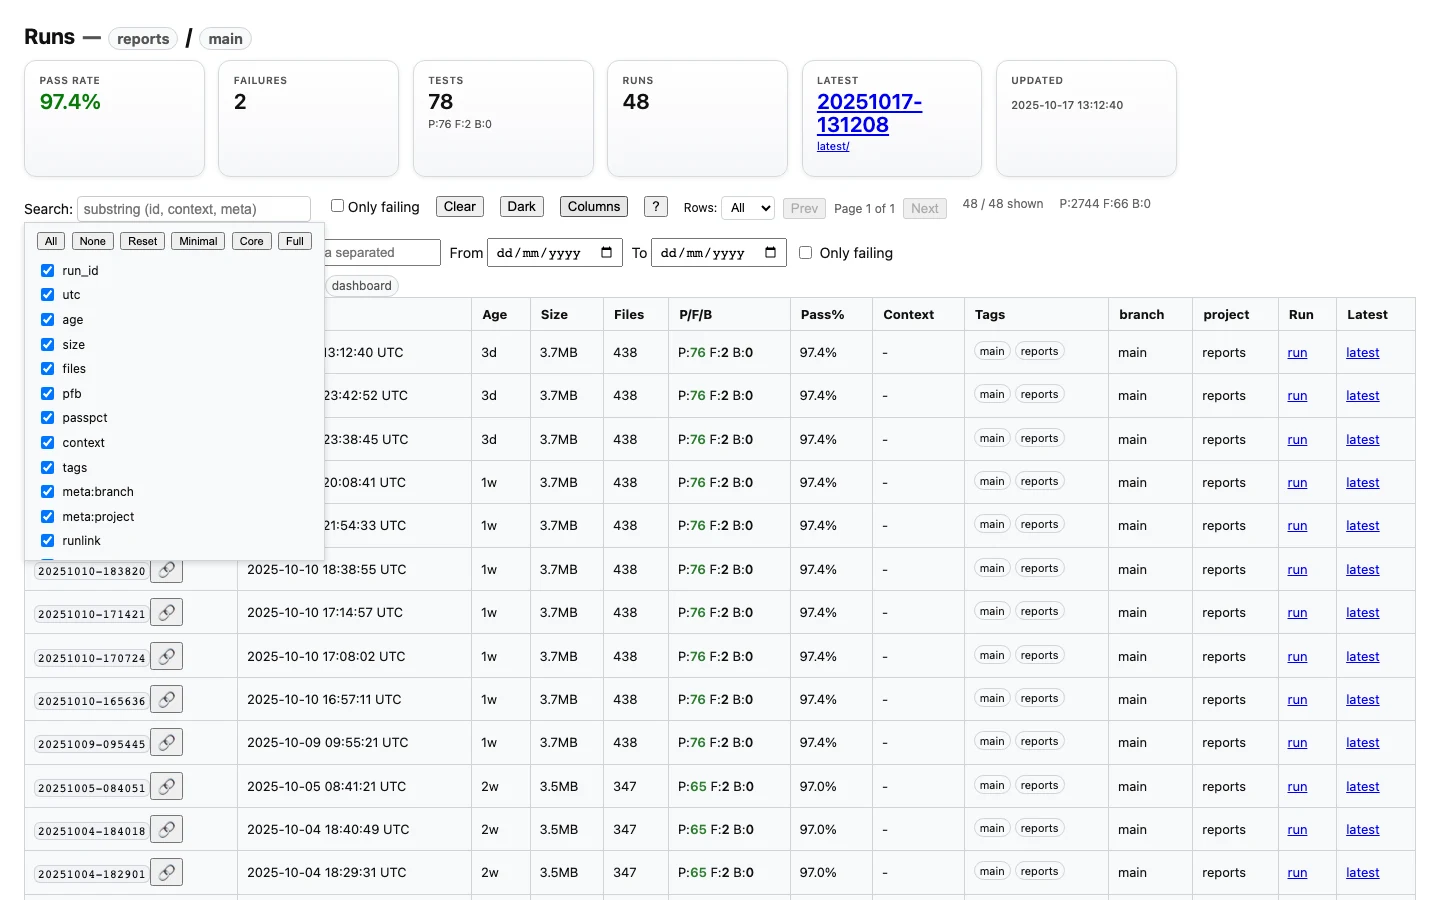
- Column Management – Show/hide columns or apply Minimal/Core/Full presets.
- Persistent State – Filter text, failing toggle, loaded row count, and sort order are saved in
localStorage. - Tag Chips – Clickable tags (if metadata supplies tags) to focus relevant runs.
- Deep Linking –
#run=<id>in URL highlights and filters to a specific run. - Dark / Light Theme Toggle – Stored preference (no external CSS framework required).
- Trend Viewer – Minimal canvas graph based solely on
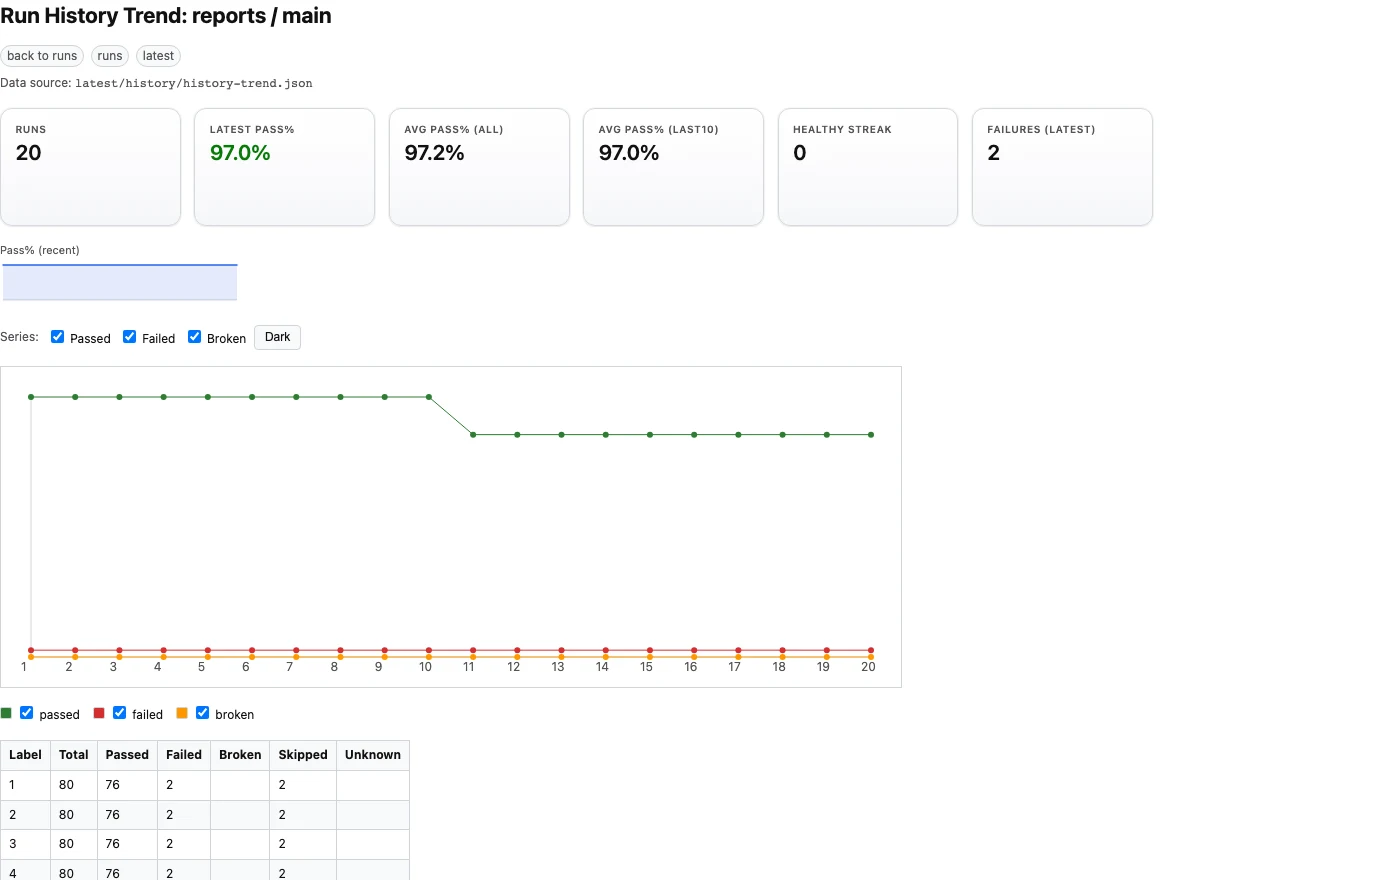
history-trend.jsonfor long‑term visibility. - History Insights – Pass rate averages (all vs last 10), current healthy streak, latest failure count.
- Atomic Latest Promotion –
latest/always points to a completely published run (two‑phase swap + readiness marker).
Screenshots
Below screenshots are illustrative. Paths assume images generated into dev/resources/.
The screenshots below reflect the current UI. Width attributes are used to keep the layout tidy across devices.
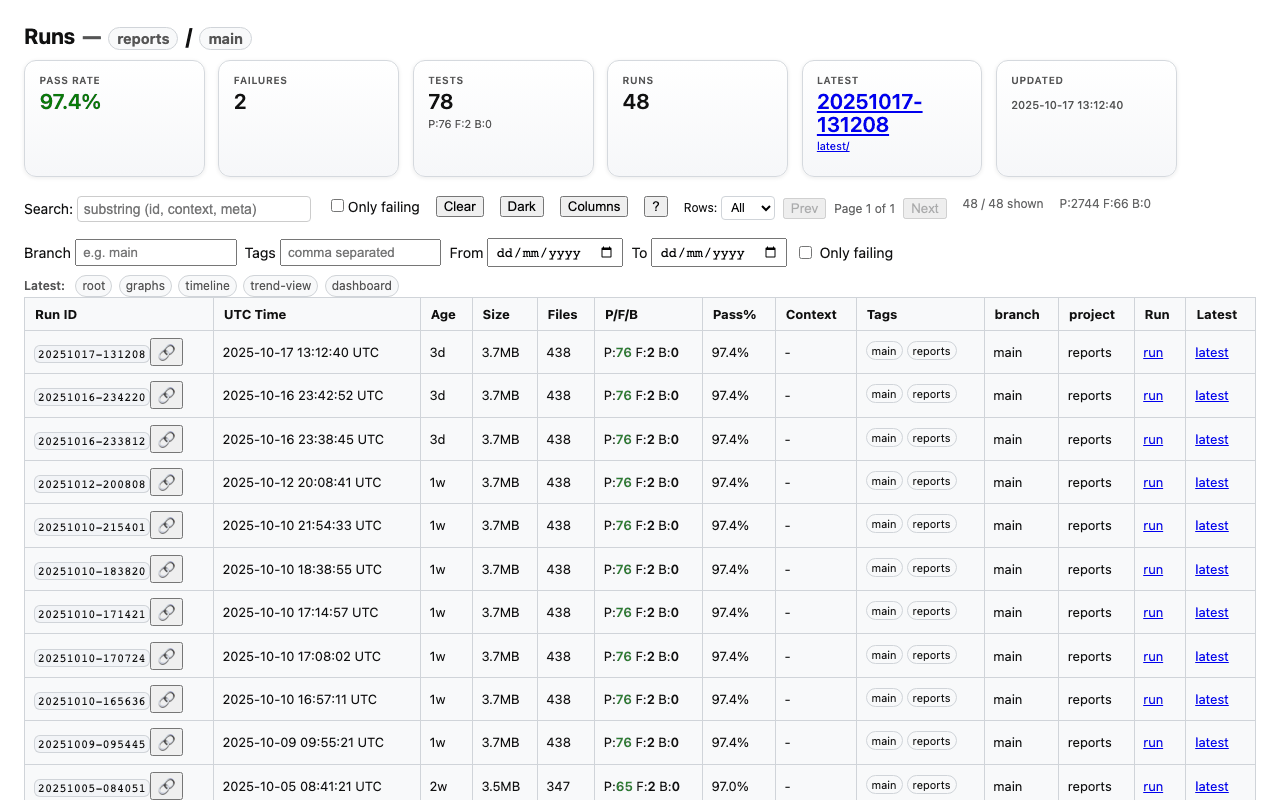
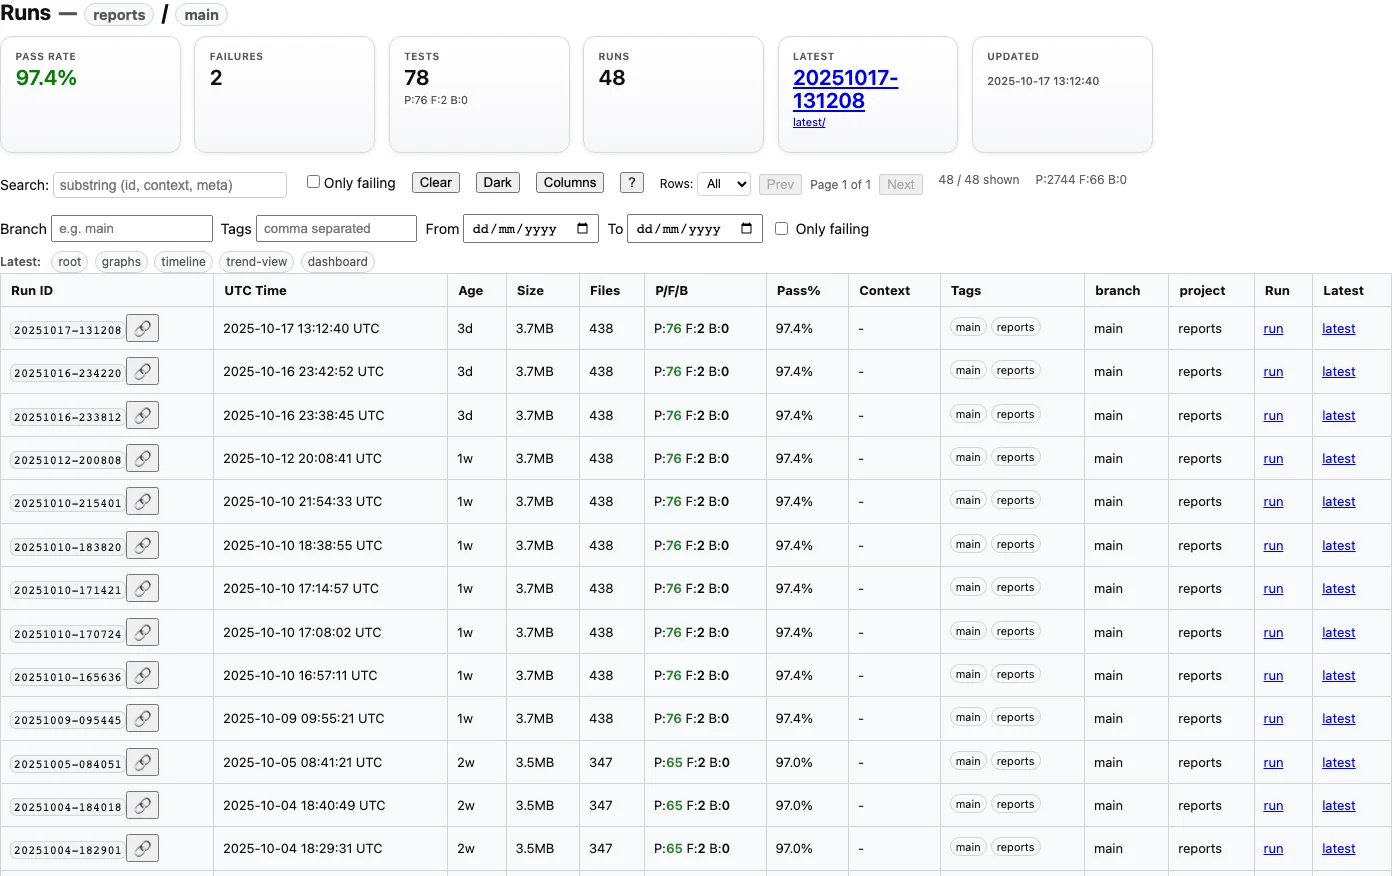
Runs Table (Base)
Columns Panel Open
Search Example
Trend Viewer
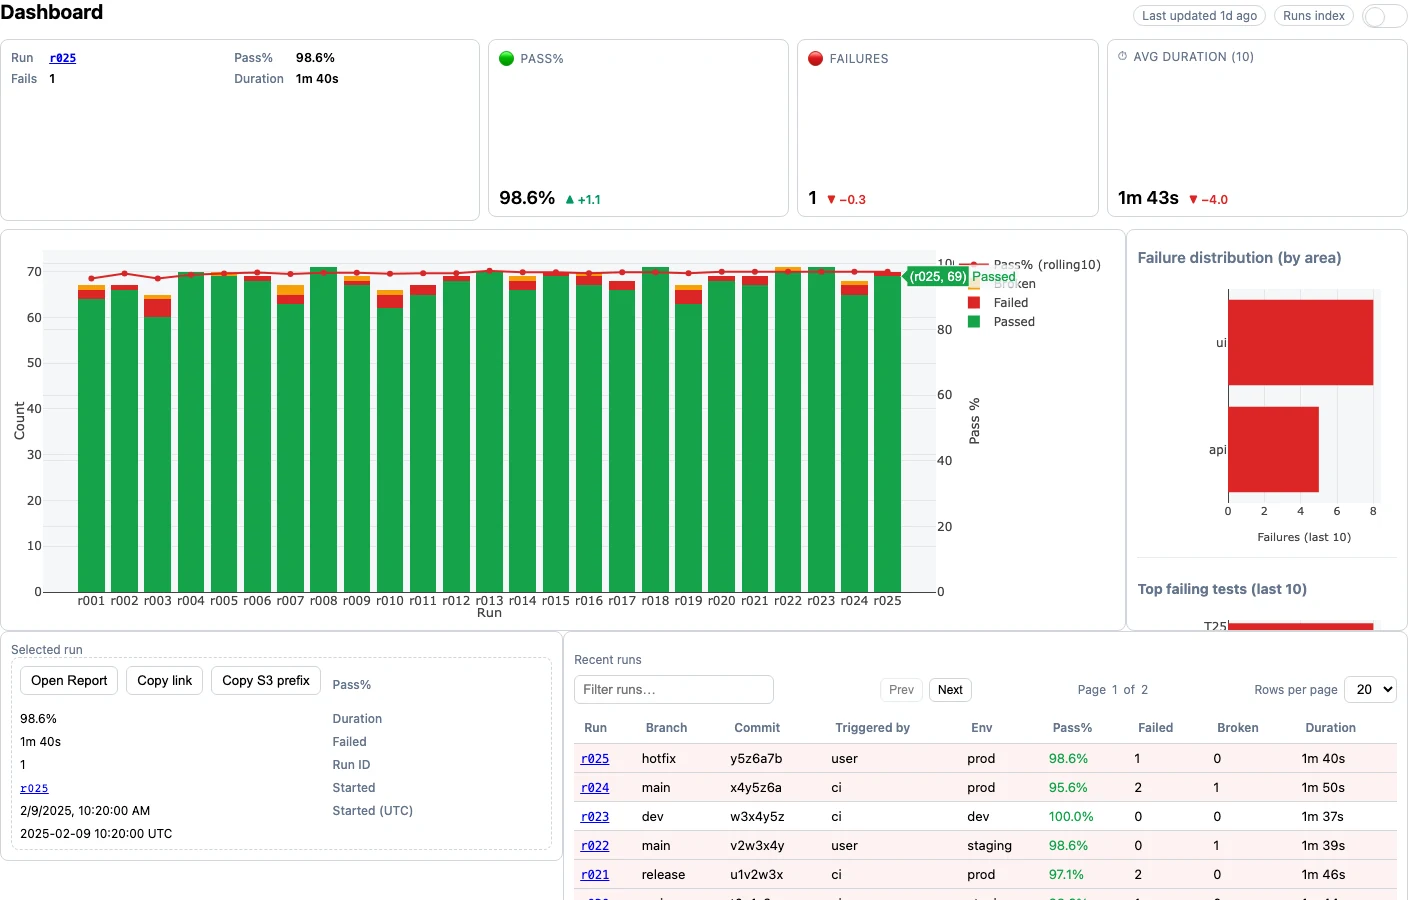
Dashboard
An at-a-glance overview of recent runs, key KPIs, and quick links into the latest Allure report.
Data Flow Summary
- Manifest Update: Each publish merges a new entry into
runs/index.jsonwith size, counts, metadata. - Index HTML: Server generates a pre‑rendered table subset (first ≤500 rows) plus JS for client features.
- Trend JSON: Allure’s
history/history-trend.jsonis reused for both trend & insights pages. - Caching: Index/Trend/History pages use
Cache-Control: no-cacheso table & metrics refresh instantly. - Latest Swap:
latest_tmp/→latest/promotion ensures the latest viewer is never half‑uploaded.
Accessibility Considerations
- High contrast adjustments in dark theme for pass/fail/broken status colors.
- Column toggle & help panels use
aria-expandedand keyboard focus trapping (close withEsc). - Tag chips and link buttons have
aria-labelhints for assistive tech.
Future Enhancements (Roadmap)
| Idea | Benefit |
|---|---|
| Sparkline Mini Charts | Quick visual density for recent pass rates. |
| Column Preset Persistence per Branch | Different branch personas (e.g. release vs main) |
| Dark Mode Screenshot Variants | Documentation parity in both themes. |
| Diff‑Skip Screenshot Task | CI noise reduction for unchanged renders. |
| Metadata Column Grouping | Clarity for large custom metadata sets. |
Return to CLI or Architecture.