Reporting Pipeline
This page describes how DriftSpend turns raw AWS billing data into a weekly HTML report and static dashboard.
The implementation is intentionally small: two Lambdas, one S3 bucket, optional CloudFront distribution, and a scheduled EventBridge trigger.
1. End‑to‑End Reporting Flow
The diagram below shows the high‑level reporting pipeline.
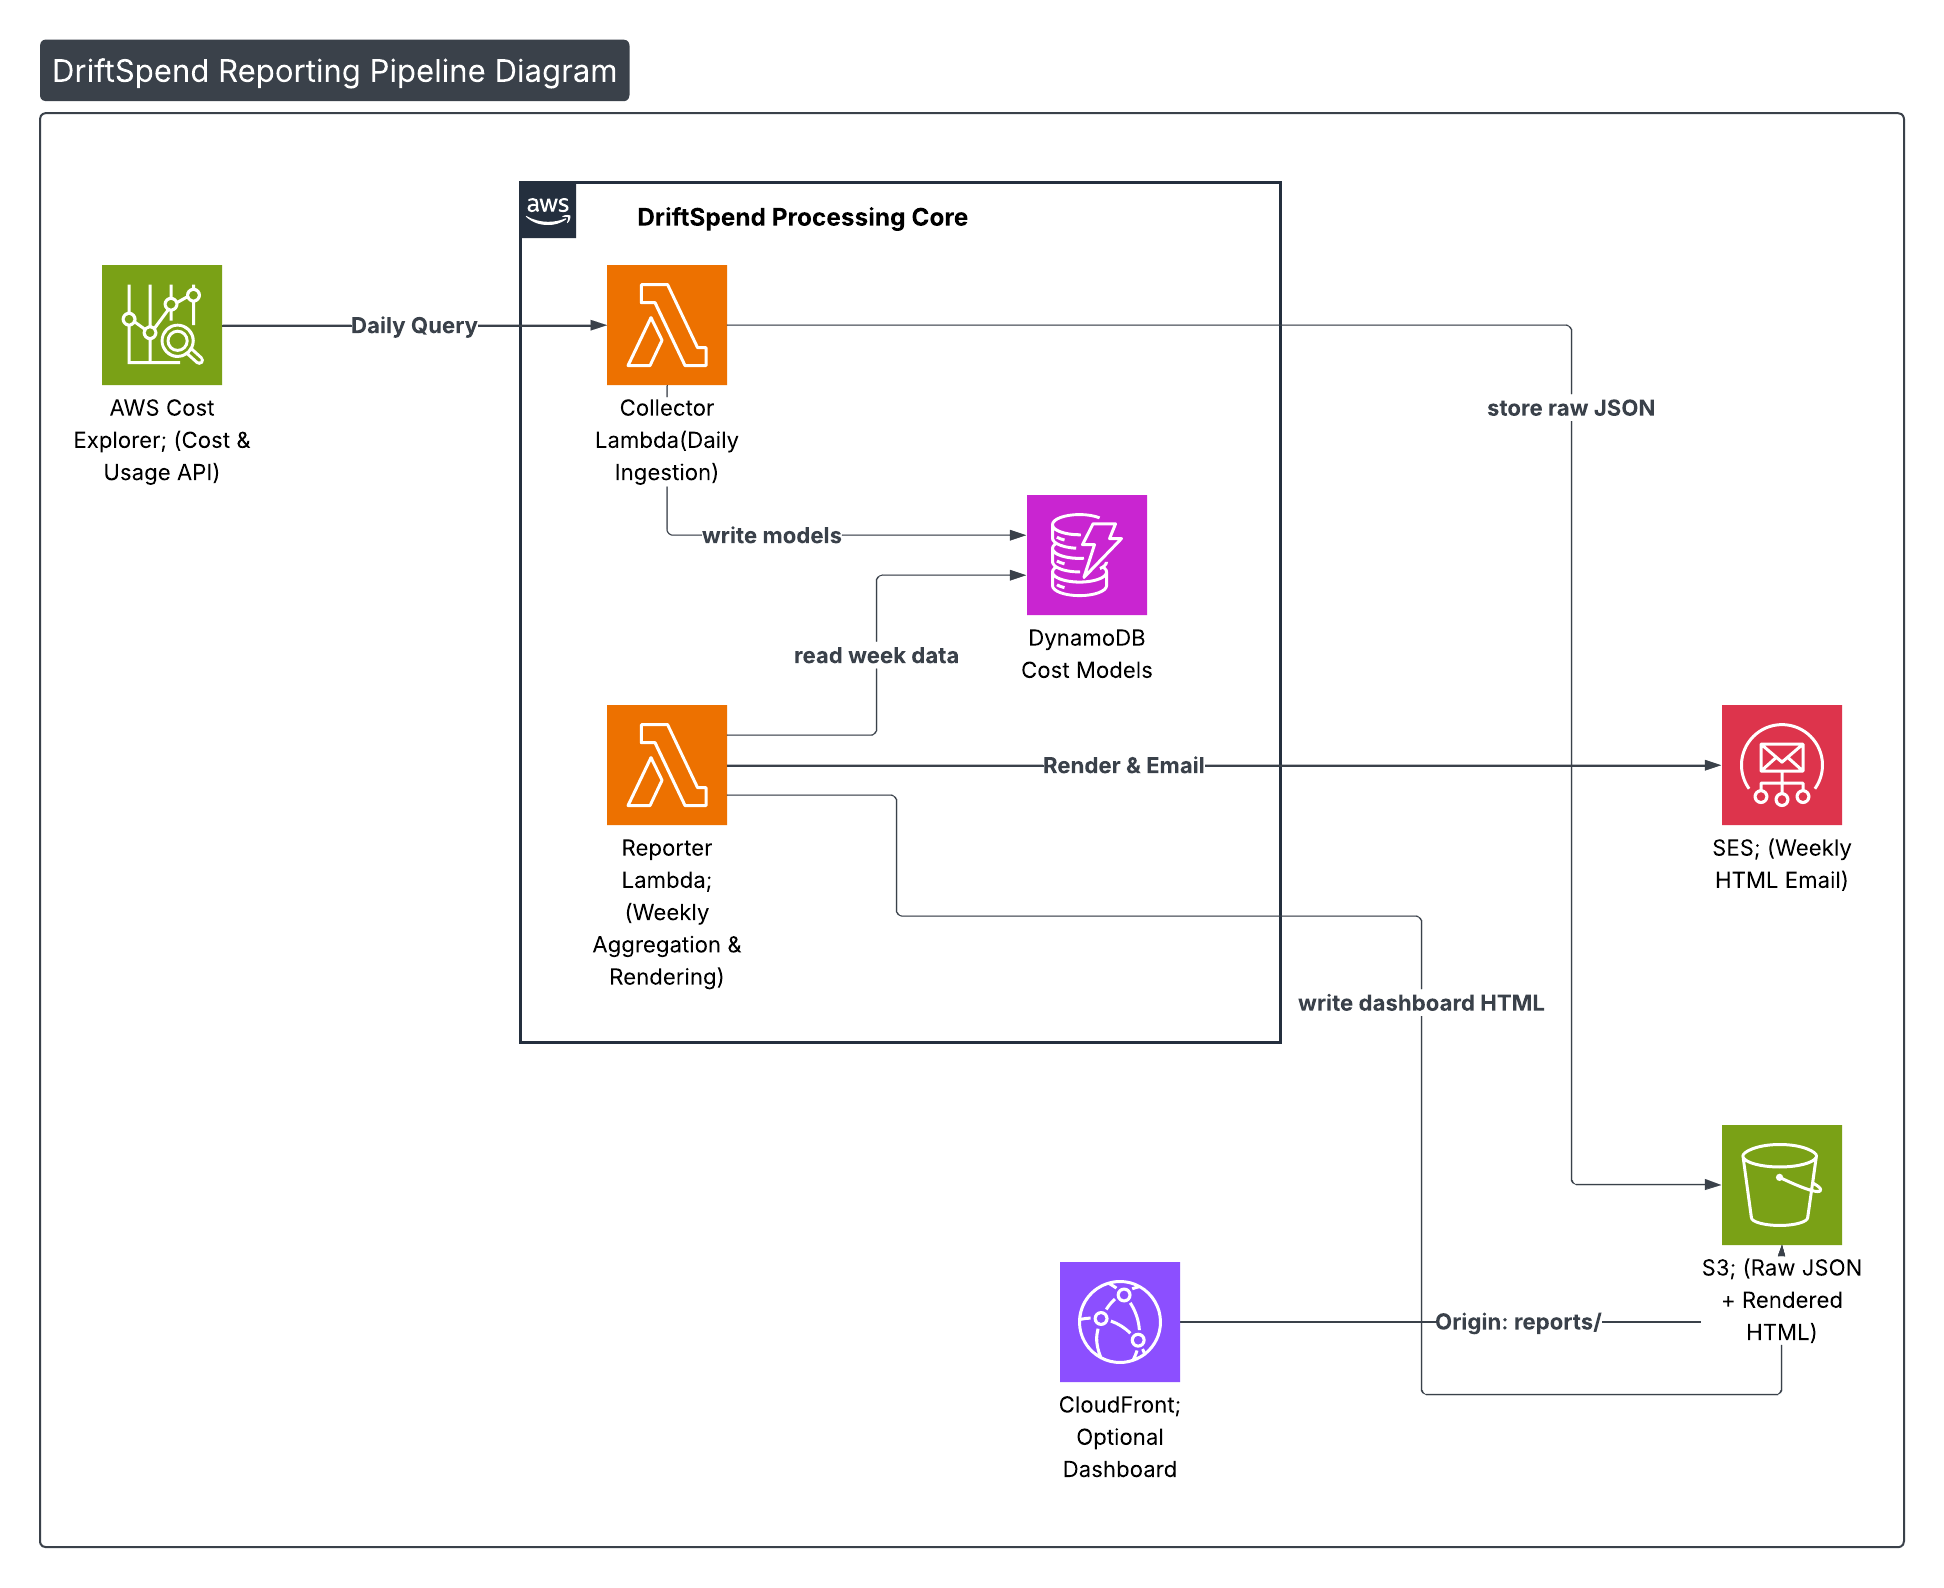
At a glance:
-
Collector Lambda (daily)
-
Triggered by EventBridge on a cron schedule
- Calls AWS Cost Explorer to fetch the last 7 days of cost and usage
- Normalises the response into core data models
-
Writes JSON snapshots to S3 under
reports/raw/ -
Reporter Lambda (weekly)
- Triggered weekly by EventBridge
- Reads the last 7 days of JSON from S3
- Hydrates the shared data models used by the collector
- Aggregates totals and computes projections
- Renders the HTML email + dashboard via a Jinja2 template
- Sends the email via Amazon SES
- Uploads dashboard HTML back to S3 (optionally fronted by CloudFront)
The core idea is that data models and templates are shared between the Lambdas, so adding new metrics usually means:
- Extend or refine a model (for example, add a new projection field).
- Adjust a single Jinja2 template.
- Re‑deploy; the pipeline behaviour stays the same.
2. Sample Weekly Email Report
To make the pipeline concrete, the following screenshots show a real DriftSpend weekly email generated from a small personal AWS account.
2.1 Summary & Top Services
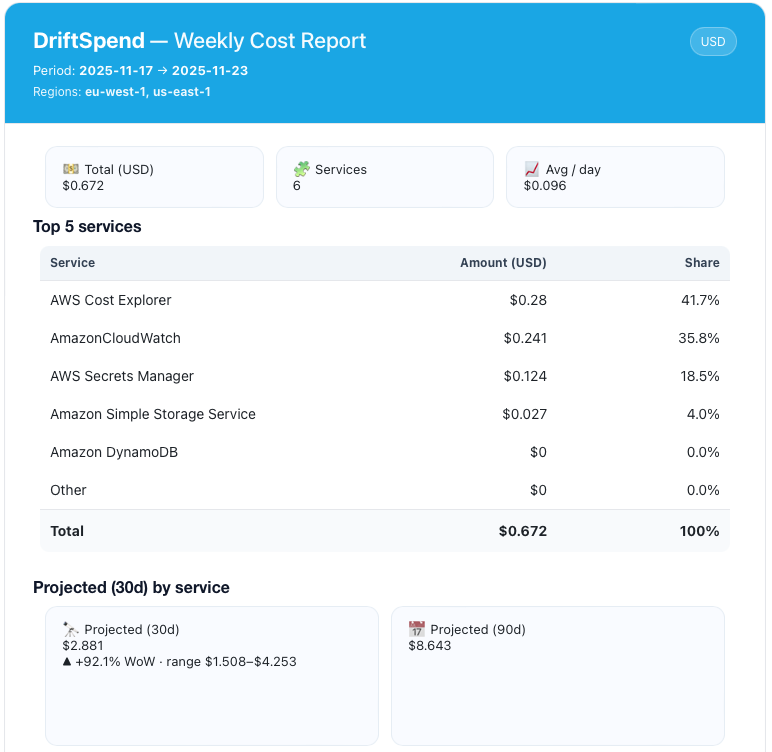
Highlights:
- Header bar shows the reporting window and the regions included in the analysis.
- KPI cards summarise total weekly spend, number of services with non‑zero cost, and average daily spend.
- Top services table ranks services by weekly cost and share of total.
- Results are rendered with tabular numerics so columns line up cleanly across clients.
2.2 Projections & Regional Breakdown
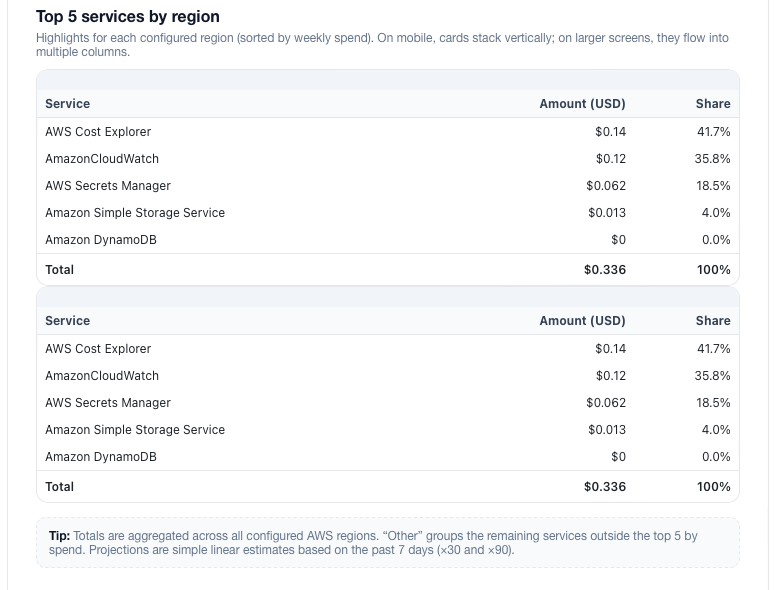
What this section conveys:
- Projected (30d / 90d) cards use simple linear projections:
- 30‑day =
(week_total / 7) × 30 - 90‑day =
(week_total / 7) × 90 - The projection range (low / high) comes from the minimum and maximum daily totals in the week.
- The Projected (30d) by service table answers "if this week repeated for a month, where would the money go?".
- Top services by region highlights per‑region spend while keeping the table layout consistent.
All of these sections are driven by the core data models described in the Data & Model page; the reporting pipeline simply wires those models into a schedule and a template.