1. Data Model Overview
DriftSpend keeps the data model small and explicit. Instead of dumping raw Cost Explorer responses straight into reports, the system normalises them into a handful of clear, typed models.
These models are:
- easy to test locally
- easy to evolve without breaking templates
- independent of any one AWS account or environment
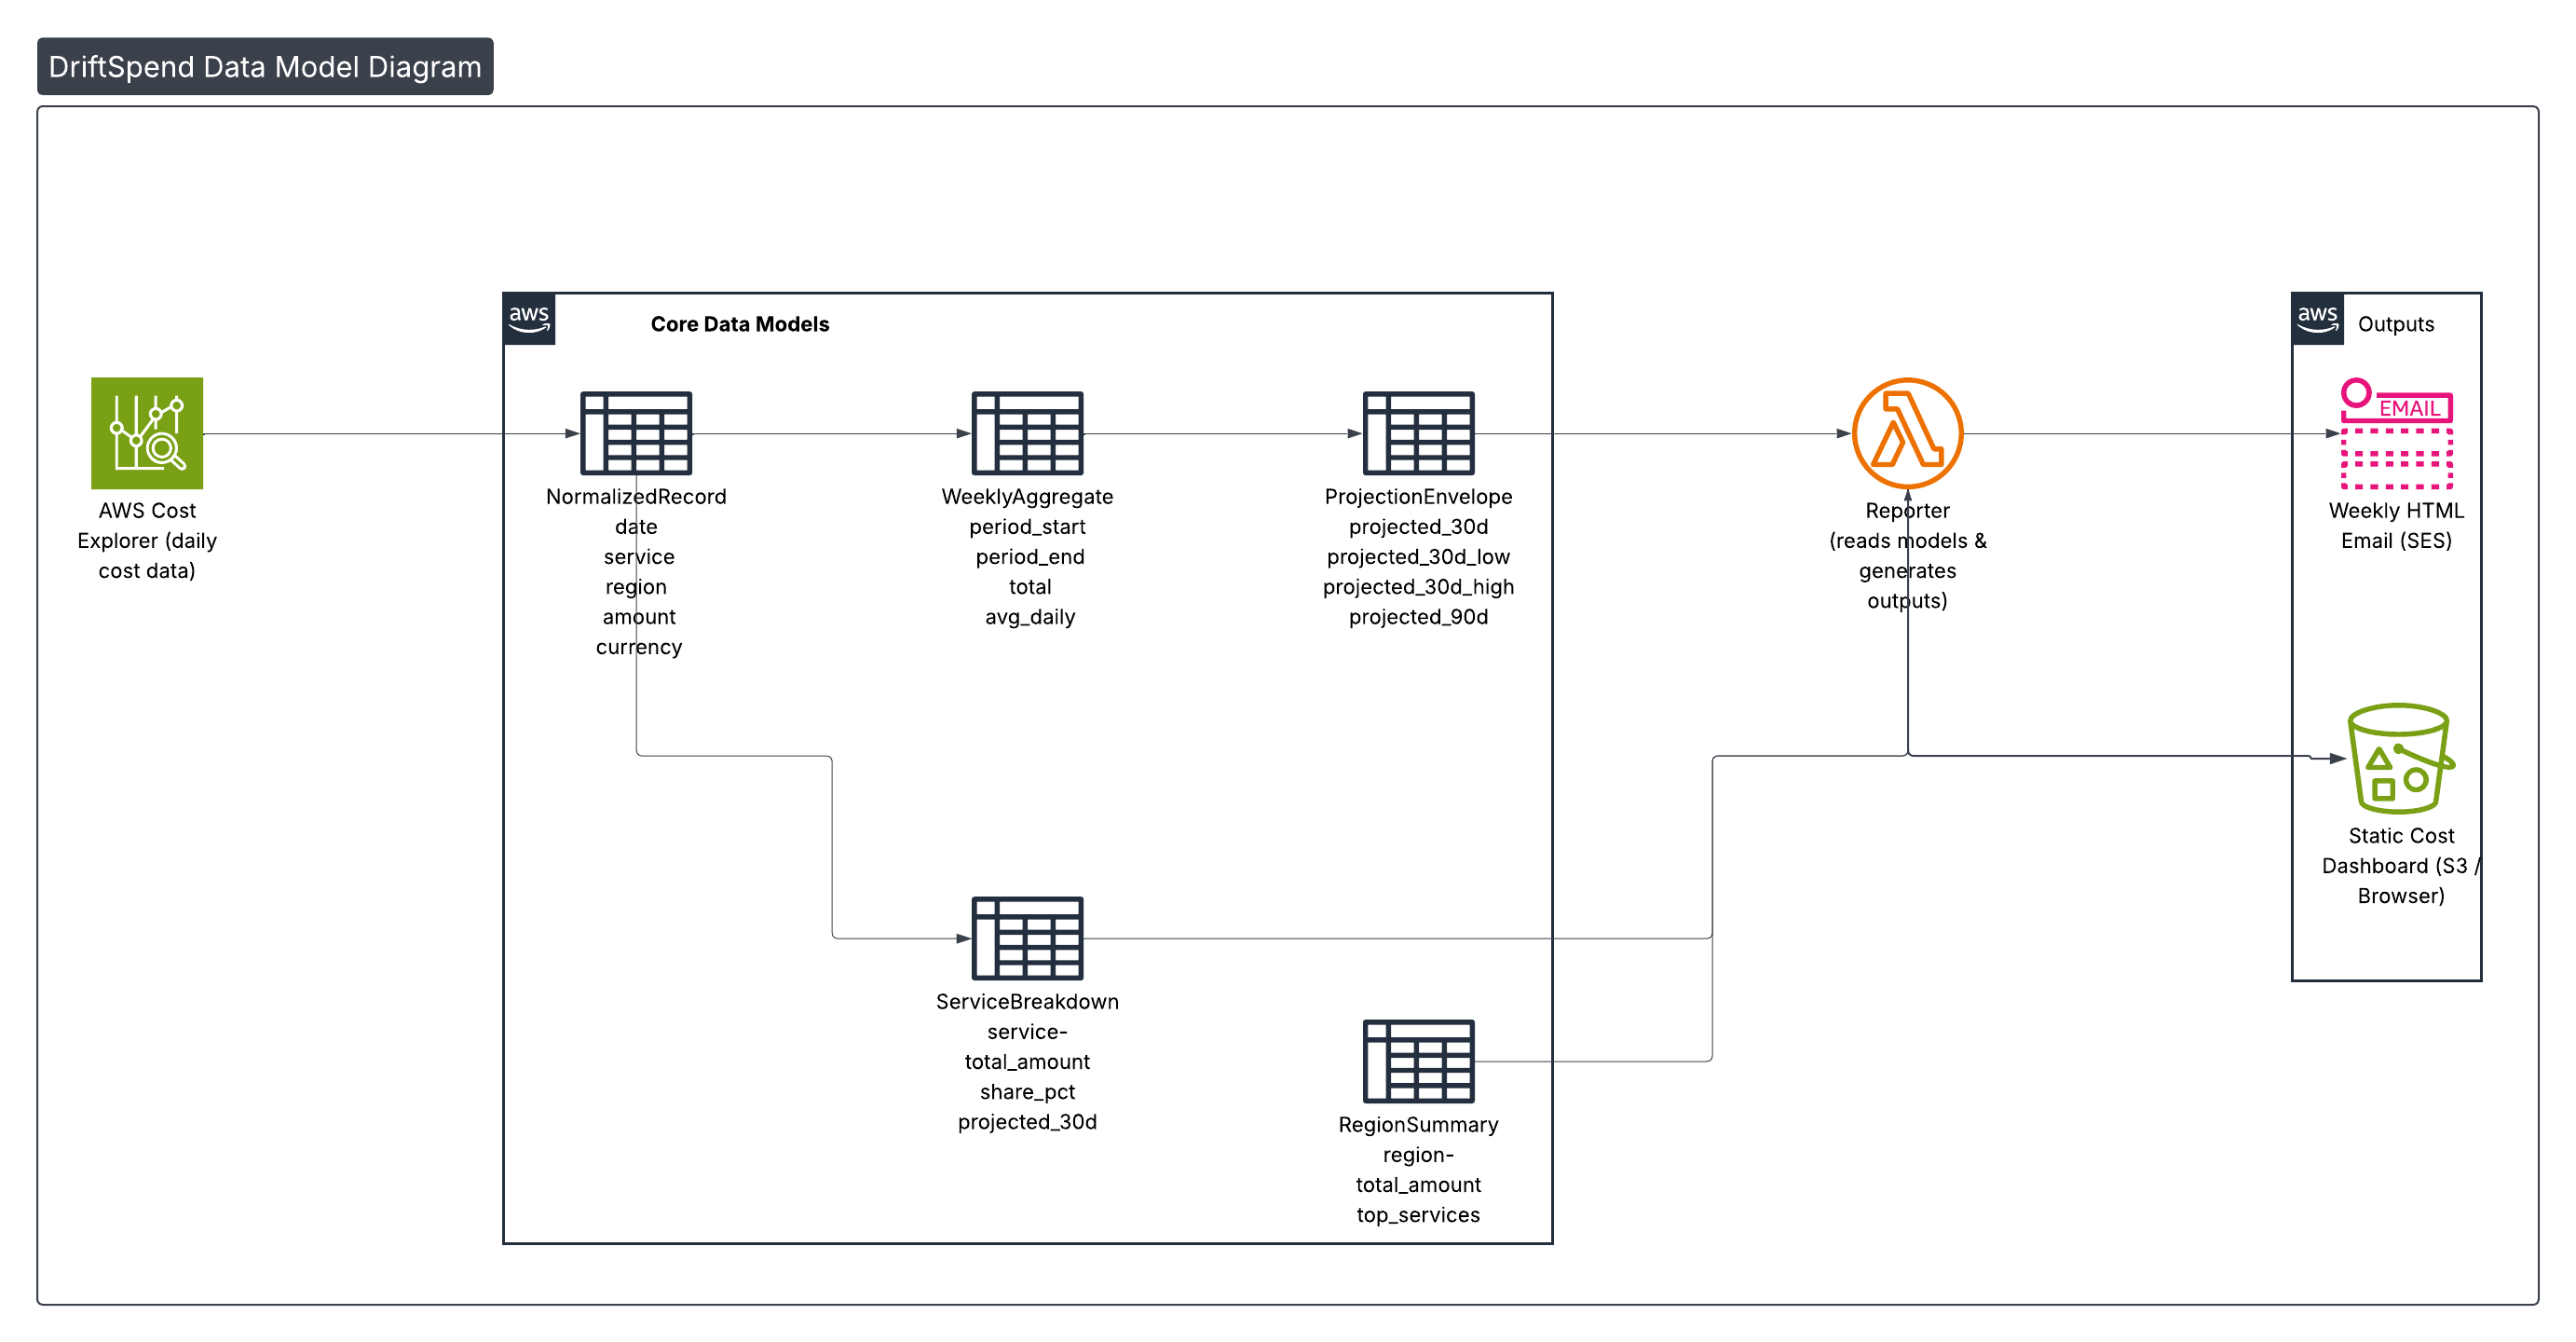
The diagram below shows how the main models relate to each other and to the report outputs.
💡 Tip: Click or tap the image to zoom when viewing this page in a browser.
2. Core Data Models
2.1 NormalizedRecord
Represents a single daily cost entry for a service in a region. This is the smallest unit of data the rest of the pipeline works with.
| Field | Type | Example | Description |
|---|---|---|---|
date | string (ISO date) | "2025-11-17" | Day of spend |
service | string | "AmazonCloudWatch" | AWS service name |
region | string | "us-east-1" | AWS region code |
amount | float | 0.114 | Cost in specified currency |
currency | string | "USD" | Currency code (ISO 4217) |
All other models are derived from collections of NormalizedRecord rows.
2.2 WeeklyAggregate
Represents the seven‑day window used for weekly reporting.
| Field | Type | Description |
|---|---|---|
period_start | date | First day included in the week |
period_end | date | Last day included in the week |
total | float | Sum of all amount values in the period |
avg_daily | float | total / 7 |
This is the primary input for all projections.
2.3 ProjectionEnvelope
Captures simple linear projections for the coming month or quarter based on the latest week.
| Field | Type | Description |
|---|---|---|
projected_30d | float | 30‑day projection from average daily spend |
projected_30d_low | float | 30‑day projection using the lowest daily spend |
projected_30d_high | float | 30‑day projection using the highest daily spend |
projected_90d | float | 90‑day projection from average daily spend |
These values are shown in the email as headline KPIs and are re‑used in the dashboard.
2.4 ServiceBreakdown
Represents the top services by cost for the week, plus their contribution as a percentage of the total.
| Field | Type | Description |
|---|---|---|
service | string | AWS service name |
total_amount | float | Weekly spend for this service |
share_pct | float | total_amount / week_total * 100 |
projected_30d | float | 30‑day projection if the service continues at this rate |
The email template uses a small number of ServiceBreakdown rows to build the Top N services table, plus an Other row to avoid long tails.
2.5 RegionSummary
Provides a per‑region view that highlights where spend is concentrated.
| Field | Type | Description |
|---|---|---|
region | string | AWS region code |
total_amount | float | Weekly spend in that region |
top_services | list | Short list of services by amount |
Region summaries are rendered both as card‑style blocks and as a tabular breakdown in the email and dashboard.
3. How the Models Fit Together
High‑level flow:
Cost Explorer → Collector → NormalizedRecord snapshots → Reporter →
WeeklyAggregate + ProjectionEnvelope + ServiceBreakdown + RegionSummary →
Template Context → Email & Dashboard Outputs
Collector Lambda
Produces the raw building blocks
- Queries Cost Explorer for the period.
- Normalises raw groups into
NormalizedRecordrows. - Persists compact JSON snapshots (time‑scoped) to S3.
Reporter Lambda
Assembles weekly insight models
- Loads recent
NormalizedRecordsnapshots. - Builds
WeeklyAggregate(totals + averages). - Computes
ProjectionEnvelope(forward estimates). - Derives
ServiceBreakdown(top services) &RegionSummary(regional view). - Packages everything into a single template context object.
Templates & Outputs
Renders the final presentation
- HTML email: KPIs, top services table, regional sections.
- Static dashboard: re‑uses the same context for S3/CloudFront hosting.
Why This Design
- Focused – each model has a single, clear responsibility.
- Testable – small structures are easy to mock and assert.
- Predictable – templates consume typed fields, not free‑form JSON.
- Portable – identical across environments; no account‑specific assumptions.